
Why invest in volatility? Why should volatility be considered an “asset class” in the same vein as equities, bonds and commodities? What makes it different?
The short answer is: tailwinds. The volatility funds have a unique driving force derived from the futures market that can propel volatility strategies in a way no equity fund could hope to achieve. Roll yield and the volatility risk premium can be strategically harvested whether volatility is rising or falling, very profitably and with modest risk relative to the gains. We’ll talk about roll yield in this post, and save VRP for later.
No other asset class available to retail investors has built in propellers that drive, on average, about 1/7 of the daily price movement in a predictable direction. Remember the old Soapbox Derby racers kids could make and race in Akron Ohio (and still can)? And the scandal that erupted in 1973 when the winner was disqualified for secretly adding an electromagnet that gave him a boost at the starting line? Well, that was cheating. But volatility markets give volatility strategies the equivalent of a motor that drives profits (alright, and losses) at a remarkable clip, right past the other asset classes coasting along. And it’s NOT cheating, it’s real and available to anyone.
The motor is called “roll yield” and it has to do with futures pricing. The details are laid out more thoroughly in “Why Volatility? A Primer”, but the essence is that there are two types of volatility funds, long volatility and short (or inverse) volatility. Long volatility funds (like VXX, an ETN) tend to rise as volatility goes up, while inverse funds (like XIV, another ETN) tend to rise as volatility falls or stays flat. But they don’t track the VIX index of volatility, published by the CBOE. Instead they track a comparable index of futures, investing in the first and second month VIX futures contracts. So VXX is essentially buying volatility (going long on VIX futures contracts), and XIV is selling volatility (selling those same contracts).
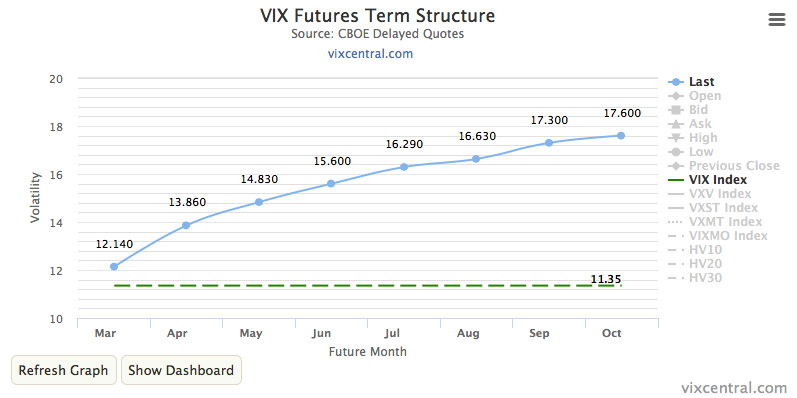
The tailwind comes about because the futures market is robust and considered. Since the long-term average historical volatility of the S&P 500 is somewhere in the 19% range (and the VIX is right around $19 as well), you’ll find that the longer term VIX futures contracts are typically priced somewhere in the $17-21 range. Even today with the VIX at near historic lows ($11.35 at the close today), the eighth month October contracts are at $17.60. With time, and continued low volatility in the markets, that price will gradually drop and drop and drop down to match the VIX at the close of trading in mid-October. So if you’d buy an October contract today for $17.60, and the VIX stayed near $11 and change, you’d lose $6, roughly a third of its value, in eight months or so.
Go visit VIX Central’s website for a moment. You’ll immediately see these prices, laid out in a Time (X-axis) vs Volatility (Y-axis) graph referred to as the futures “term structure”. In today’s case, as it has been for many months, the term structure has a positive slope from low prices (down near the VIX) in the front months and higher ($17+) prices further out in time.
Ah heck, here’s a snapshot from VIX Central in case you don’t want to go there right now. I don’t want you to miss this. (thanks, VIX Central)
Now let’s see why this particular term structure, where front months are cheaper than back months (aka “contango”), puts a tailwind behind the inverse funds (and a headwind up against the long vol funds). In essence (if not in literal truth), XIV is daily selling a combination of first and second month futures contracts. At the end of each trading day, future contracts are rebalanced so that the fund maintains the proper weighting of contracts to match the inverse of the daily return of the futures index the fund tracks, a process called “rolling”. In this case, it’s called a “30 day constant maturity” weighting, with a proportionate amount of the first month (expiring in ~30 days or less) and the second month (expiring in ~30-60 days) so as to be always equivalent to a “30-day” position in futures contracts.
Every day, rebalancing the portfolio. Each day selling some and buying others — for XIV it’s mostly buying front month contracts to cover earlier sold contracts, and selling more second month contracts. but that isn’t strictly relevant here. What is relevant is that XIV sells contracts first, and then buys them back later. When you look at the term structure, you readily see that the curve is not just a snapshot of different futures contract prices… it’s also a vector path for the evolution of one futures contract through time. If the markets keep in this low volatility regime the rest of the year, that October contract will slowly lose value, and then as it becomes the third month, and the second month, and finally the front month contract it will be losing value daily, faster and faster. Right now the front month (March) contract is only five days away from expiration, and is selling for only $12.15 (eighty cents above the VIX) and dropping fast.
So XIV sells contracts in the second month, and buys them back in the front month. Freeze today’s term structure in your mind and that means XIV was buying back month contracts in the 13.50-15.00 range, and is selling them in the $11.00-$13.50 range, so making roughly $1.50-2.00 per contract. Each day that the term structure is in contango, XIV is profiting from this “roll yield”, the yield (gain or loss) that comes from rolling the futures contracts (buying front month and selling back month contracts) each day.
VXX, on the other hand, is losing money daily from this same roll yield when the term structure is in contango. Losing badly; on average VXX loses about 4% of its value per month. Which is, very roughly, about what that October contract loses in the example earlier.
But tis not always thus. When markets get scared, the VIX shoots up, and so do the prices of the futures contracts. Typically the front months prices shoot up above the back (later) months, and the futures term structure takes on a negative slope (down to the right on the graph). Like a year ago February, 2016, when we’d been down all of January and things felt bleak. Take a look at VIX Central’s Historical Prices tab, dial it back to Feb 11, 2016 and…
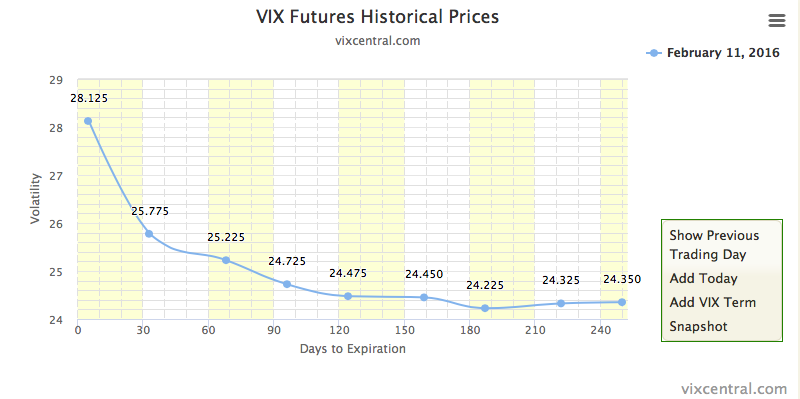
Bingo, we have negative contango (more commonly known as backwardation). The back months are up a good bit higher than today, in the $24 range, and the front month is up at $28.13 (right where the VIX was too, the front month contract was only two days from expiration). At this point, the daily roll yield was favoring VXX instead of XIV (and had been since the beginning of January), helping drive the price of VXX from around $80 at the end of December 2015 to nearly $120 in mid-February. Of course it’s been all downhill (headwinds of contango) since then, with VXX closing below $17 today.
That’s your tailwind for you. There are a few hundred different volatility strategies you can find for yourself that help tame the roll yield vagaries and turn them into volatility tailwind profits, some far better than others. The tailwinds are not perfectly predictable day to day, but you can get your winning percentage quite high with the right tools. The point of this post is not to help choose a strategy, but to point out that no other commonly available (to retail investors) asset class remotely has such a predictable tailwind driving it directionally forward. Who couldn’t use a little tailwind behind a portion of their investments?