Volatility as an asset class has alpha advantages beyond any currently available to retail investors. It is readily tradable as exchange traded products (ETPs: both ETNs and ETFs are available), with high liquidity and very low spreads/low slippage. High-performing strategies are available that do not require shorting or option spreads or intraday trading, and can be calculated simply (by hand, or with an Excel spreadsheet).
Consider this a very simplified primer explaining why trading volatility has advantages beyond the normal equities and index funds with which most retail investors are comfortable.
Volatility - a primer
Executive Summary (tl;dr) The volatility market is unique among liquid asset classes available to retail investors in that it has significant tailwinds that can drive it with strong probabilities of success. A portion of the daily price change in volatility ETPs is due to the "roll yield" (RY), related to the price difference between near term and more distant futures contracts, and is a largely predictable feature of the volatility markets. Another, usually more significant portion of the daily price change is the "volatility risk premium" (VRP), which also is reasonably estimated from market data and tends to stay in a regime (either tailwind or headwind) for volatility funds for significant periods. These predictable features combined with remarkable daily returns produce a market that is ripe for algorithmic trading gains for the retail investor. Even simple quantitative models (in Excel) incorporating VRP and RY can yield very substantial long-term gains with only modest drawdowns relative to the performance. Advanced algorithmic models may perform substantially better. Tail (black swan) risk does exist, and retail investors are likely to want to limit their volatility exposure to a portion of their investment portfolio. One simple but effective algorithmic trading strategy for volatility is presented that requires no calculations, only to lookup some market values near the end of the trading day and place appropriate trades (or hold) at the market close.
Part 1: Volatility
First, let's understand what volatility is... for our primer, volatility is a measure of how choppy the stock market is as measured by the daily ups and downs of the S&P 500 market index. Historical volatility uses a "lookback period" (5 days, 10 days, 30 days, a year) to measure how choppy (volatile) the daily returns have been recently. Technically, historical volatility is the sample (not population) standard deviation of the natural log of the daily returns over the lookback period, multiplied by the square root of the number of trading days in the year (252 most years) in order to normalize the value to an annualized figure.
Another important kind of volatility for us is "implied" volatility. Implied volatility is an estimate of what traders in the market think volatility will be in the future. Implied volatility is a measure that comes from the prices of options traded on the VIX volatility index. We don't need to understand the calculations for implied volatility for this primer, but know that implied volatility varies for every option contract, and all day long during trading as markets respond to every nuance coming across the screen of a Bloomberg terminal.
As a general rule, if the market is bullish or flat, implied volatility is higher than historical volatility. Hedge funds and other risk-averse traders will pay a premium to purchase (mainly via options) volatility, or in other words, insurance against a falling market. If the markets suddenly begin dropping, volatility will rise giving these hedgers a gain from their volatility purchases, to help offset losses from their equities that are dropping in value. The premium paid by hedgers helps keep the implied volatility higher than the realized (or historical) volatility.
This premium is called the Volatility Risk Premium, or VRP, and is very important in helping us understand volatility trading strategies. A positive VRP means implied volatility exceeds historical volatility. Negative VRP occurs when there is a sudden market scare, and actual (historical) volatility skyrockets higher than expected by the market makers. Now the expectation is that volatility will drop in the future, and hence the implied volatility priced into options is lower than the recent historical volatility.
Foreshadow: This VRP provides a portion of the tailwind that drives volatility asset class profits. Keep reading.
Practical takeaway: Volatility strategies benefit by being net sellers of insurance to the hedgers. By measuring VRP, we can make probabilistic predictions whether to invest in volatility or inverse volatility so that the market winds driving futures prices are mostly tailwinds for us. If VRP is positive, we sell volatility (go long XIV or other inverse volatility funds), and if VRP is negative, we buy volatility (long VXX or other long vol fund). The trick is properly, systematically estimating VRP.
Part 2: The VIX index
Second, let's understand what the VIX index measures, and why you cannot trade the VIX directly. The commonly used description of the VIX is "the fear index". This description alone makes the VIX fundamentally different from the other indices retail investors follow: the DJIA, the S&P 500, etc. Each of those is a simple number, an aggregate price of some bundle of stocks showing where "the market" went today, or this year. At any point in time, those market indices denote where the market is right then. A "fear" index, by design, must be forward-looking, attempting to look ahead, to prognosticate. In this case, it's a volatility index, so it must be a measure of volatility, but which type? Historical or implied vol?
If this sounds like implied volatility, congrats because that's exactly what it is, based on put and call options trading on the S&P 500 index. If it were historical volatility, it wouldn't be a fear index at all, just a status, a look at how markets have behaved over the past X trading days. But an implied volatility index is truly meaningful, because real market traders are putting their money where their mouth is, and paying for (or selling) options that indicate a meaningful level of uncertainty about the market volatility in the days to come.
Until 2014 the VIX was based on monthly options contracts, but now it's based on both monthly and weekly options, and requires significant calculations (read this CBOE white paper for full documentation, if you dare). You don't need to know how to calculate it, but it is useful to have a sense of what that number means. If the VIX on March 3, 2017 closed at $10.96, forget the the dollar sign, and think of it as a percentage (0.1096, or 10.96%). This is what market makers expect the volatility of the S&P 500 to be about 30 days from now. But what is that number really, what's it compare to? Well, remember it's a standard deviation estimate, an indicator of the likelihood that the volatility will be within such and such a range. So first we can compare VIX to the historical volatility of the S&P 500, just like we discussed in Part 1 above. As of March 3, the 20 day HV is about 6.7% (20 trading days is about one month), the 5 day (one week) HV is around 11% (a bit higher, because of that nice day up we had on March 1). A weekly estimate of the HV will bounce around a good bit compared to the monthly estimate. And finally, the HV for an entire trading year ending March 3 was about 10.1%, all in all a quiet 12 months (by March 2016, we were on the way up and up). In contrast, last March 3, the one year HV was just 16%, representing a much messier 2015 and first two months of 2016. And the VIX on that day closed just higher, at 16.7%.
The VIX is volatile. The VIX goes up, and the VIX comes down. Down is where it is today; all the market-talk is about how low the volatility has been how many days in a row below this number or that one, how rare this low volatility is historically, and so on. It's not news! The VIX always comes back down sometime, to somewhere in this neighborhood. And market shocks will send the VIX back up into the 20s and beyond, and then it will come down again.
Quick Takeaways: Remember that market makers and traders who trade the VIX options that control the VIX index are not omniscient. The VIX really is a "fear" index, rather than a prediction of where the market volatility will be 30 days from now. Case in point: on March 3 2016 with the VIX closing at $16.7, it was down almost 20% in 3 days from $20.45, which was itself down almost 40% from $28.14 on Feb 11. And it dropped as low as $13.10 before another 20 trading days passed (another 20% drop, if you're counting). Takeaway #1: the VIX is volatile. This is just a recovering market example, the fear factor makes rises in VIX (due to market falls) much faster than the recoveries. Takeaway #2: market makers aren't very good predictors of volatility, if you think of the VIX as a predictor rather than a fear index.
Part 3: Trading the VIX
You can't trade the VIX. If you could simply trade the VIX, it would be an easy game to play. Buy VIX when it's low and sell when it shoots up, or short VIX when it is high and buy to cover when it comes back down. But, as ever, there's no free lunch in investing... you can't buy the VIX (there's no ETP that can duplicate the VIX), and for technical reasons nobody else can either, not even the fanciest hedge fund, at least not both profitably and accurately under all market conditions. That's part of what makes it all so interesting.
Instead if you want to trade the VIX volatility, you trade futures, options, or exchange traded products like ETFs and ETNs. Futures and options are messy and demanding for the retail investor, especially compared with ETPs. ETPs can be traded in a retail IRA account; no such luck with futures or naked options. We're not going to cover volatility futures and options here, and we're not going to cover all the ETPs, either. We're going to stick with the Big Two: VXX (a long volatility ETN - exchange traded note) and XIV (an inverse volatility ETN). They're highly liquid with very low bid-ask spreads, easy to trade. But read carefully: trading the VXX fund is NOT "trading the VIX" and trading the XIV fund is neither "the opposite of" the VXX nor is it shorting VXX nor is it the inverse, nor the opposite of the VIX itself. VXX and XIV are volatility funds with unique qualities, but not those qualities. We'll explore and find out why.
VXX - iPath S&P 500 VIX Short-Term Futures ETN: Read that full name again... VXX follows an index of VIX futures, not VIX options (and not S&P 500 options, like the VIX itself). The "Short-Term" part of the name means it focuses on the futures contracts expiring sooner, rather than farther out into the future. A bit more specifically here:
What VXX is:
- VXX tracks a volatility index, but not the VIX. Just like the name says, VXX tracks the "S&P 500 VIX Short-Term Futures Index". This is not a very commonly reported index, but is very important for this and several other volatility funds.
- VXX has behavior equivalent to buying a 30-day constant maturity weighted combination of the first and second month VIX futures contracts. First month means the one that is expiring in about 30 days or less, and the second month is the one that expires more than 30 days out, and less than about 60.
- Constant maturity here means that there is a daily purchase of the two futures weighted so as to have the equivalent of a 30-day maturity. Near the beginning of a first-month contract, it would be weighted mostly first month, and a small fraction second month. Nearing expiration of the first month, the index is weighted more and more heavily in the second month contract.
- By now, I hope you've looked at either of those two links above (either the VXX link or the index that it follows) deeply enough to have noticed that the price of VXX tends to drop month after month. This is crucially different than the VIX! In fact, if the VIX failed to drop at all, and just sat motionless with no change in implied volatility in the markets at all, VXX would continue to drop in price, dramatically. On average, VXX drops in price about 4% per month, or 30% per year. Yikes!
- WTF? VIX stays flat, VXX drops, fast? Yes. Remember the VRP earlier, that premium paid by traders to insure themselves against volatility going up? Of course you do. Well, VXX is buying volatility protection, day after day after day, holding it in hopes that volatility will indeed go up! If volatility stays flat, VXX loses the equivalent of the insurance premium, day after day, month after month. Volatility insurance is expensive.
- A simple measure of this insurance premium is to look at the "term structure" (shape of the curve) for the VIX futures market. Go visit VIX Central for a moment and see what the prices of the futures contracts are right now. For me, the March contract (1st month, expires in 10 trading days) is priced at $12.62 and the April contract (second month) is $14.45. Both of these are a dollar or more above the actual VIX at this point in time. VIX Central doesn't show the 30-day constant maturity, but it's somewhere between the 1st and 2nd month prices. The farther above VIX these futures are priced, the bigger the VRP, or insurance premium. There are many, related measurements of the VRP, but it's not an exact measurement, more of a series of indicators pointing toward the existence of the VRP and its approximate size.
- A related measure is contango, a condition where the first month price is lower than the second month price, or (another way to say it) a positive slope to this futures term structure. Look at VIX Central again, and see the table of contango values. The 2/1 contango is the price difference ($1.83) or normalized to the first month as a percentage, 14.5%. A positive contango usually means VXX will lose value today, if volatility stays flat (see roll yield below).
- Volatility never stays perfectly flat however. So there's not a nice clean 1:1 relationship between contango and VXX prices. VXX responds both to contango and to daily changes in futures prices (usually correlated with volatility changes). However, as a first order predictor, contango is a pretty decent indicator of VXX prices. When contango is a positive number (2nd month higher than first month price), VXX is likely to decline in value. When contango is negative (also called backwardation), VXX is for similar reasons likely to increase in value.
- A closely related term for this concept is "roll yield". It refers to the yield (gain or loss) achieved from "rolling" futures contracts from day to day to day (this is what the index tracked by VXX synthesizes). Roll yield for VXX is negative (causing daily losses) during contango, and is positive (causing daily gains) during backwardation.
- Compounding of that average 4% monthly loss means that VXX loses a LOT on an annual basis. Investing $10,000 at the beginning of 2015 would net you a -26% loss in 2014, another -36% loss in 2015, and a whopping -78% in 2016. The extra big losses in 2016 result from big declines in volatility as well as the roll yield.
- Roll yield is one of the most easily misunderstood concepts in volatility trading (I'll cover this in a blog post soon). Fortunately, from a practical standpoint, just remember two things about roll yield and VXX: (1) roll yield due to contango is a headwind for VXX (backwardation produces a tailwind), and (2) VXX price changes on a daily basis tend to be dominated by change in the 30-day constant maturity value, not by roll yield.
What VXX is NOT:
- VXX does not track the VIX. Too many people with some money to lose make this mistake, and buy some VXX when the VIX is low, thinking it can only go up from here. Few things are more wrong in the investment world.
- VXX is not a good long-term investment. See problems above.
Other things to know about VXX:
- VXX trades like any stock fund, and is very liquid. The bid/ask spreads are so low (typically a penny) that you can place market orders without slippage worries.
- Tracking an index makes VXX similar to other index ETPs, like the SPY ETF that tracks the S&P 500 market index. First remember that it's not tracking the VIX, and you're on the way to understanding it.
- Next remember that VXX has none of the characteristics of stocks and stock funds that commentators love to go on about during the market news cycle. There are no resistance or support levels, no fundamentals, no profits or dividends, no quarterly earnings reports, none of it. Volatility is a completely different asset class, with almost completely different drivers.
What is VXX good for? Who would buy it??
- Hedgers: VXX is the most liquid, easily purchased volatility insurance/hedge around. That says nothing about its cost effectiveness as a hedge, it's just one reason for buying VXX.
- Traders: Traders with knowledge of the predictors of VIX futures (like the VRP and roll yield) purchase VXX when these indicators suggest that on average, VXX is likely to gain daily value from the futures term structure. Because VXX can skyrocket when markets crash, these trades can be very profitable.
- Long-term shorters: There are some very patient folks who wait for a spike upward in the VIX (and in VXX) and then short it, with the intention of holding it a long time and capturing that contango-driven price drop. This is not for the faint of heart, or the shallow of pockets, since you may short VXX and watch the price go significantly higher if the market melts down. Make sure you've committed enough funds to be able to handle any margin calls and be patient... even 2008 ended, eventually.
- Dummies: If you don't understand this stuff, or won't learn it, VXX is not for you. A step beyond would be dummies who buy options on VXX thinking it's the same as VIX. Both life forms exist (read woes in investment forums and blog comments everywhere).
- Nobody else: VXX is not for most folks, and is absolutely not for investors who fail to learn at least these basic concepts.
XIV - VelocityShares Daily Inverse VIX Short-Term ETN: XIV is not Vol: it's the inverse of Vol! XIV replicates the daily inverse return of the same index of VIX futures used by VXX. A bit more in depth:
What XIV is:
- XIV tries to produce the inverse of the daily returns of the same index that VXX tracks (not the VIX). So if VXX goes down about 1%, XIV should go up about 1% (and it usually does, quite closely).
- XIV has behavior equivalent to selling a 30-day constant maturity weighted combination of the first and second month VIX futures contracts. This is the opposite/inverse of VXX, which is equivalent to buying those same contracts.
- Overall, XIV is selling volatility insurance, in contrast with VXX paying that insurance premium. So the roll yield for XIV is roughly the opposite of that experienced by VXX, and the value of XIV just keeps on going up and up, interrupted by a quick drawdown, and then up and up some more. XIV is up roughly 35% annually since inception in November 2010. That said, the price can drop precipitously, with drawdowns of 40-70% in the space of a few days or weeks, so it's not for the weak of heart. But as long as positive contango is on the horizon, XIV should be good to go for the long run.
- XIV has a pretty nice relationship with the S&P 500. Usually, if the S&P 500 is moving upward, then XIV is moving upward too. Usually, but not always. Correlation, not causality.
- Remember two things about roll yield and XIV: (1) roll yield due to contango is a tailwind for XIV (backwardation produces a headwind), and (2) XIV price changes on a daily basis tend to be dominated by change in the 30-day constant maturity value, not by roll yield. For both VXX and XIV, volatility on a daily basis usually dwarfs the roll yield.
What XIV is NOT:
- XIV is not the opposite of the VIX, nor does XIV always go up when the S&P 500 goes up! Do not expect such things.
Other things to know about XIV:
- XIV trades like any stock fund, and is very liquid. The bid/ask spreads are so low (typically a penny) that you can place market orders without slippage worries.
- Tracking an index makes XIV similar to other index ETPs, like the SPY ETF that tracks the S&P 500 market index. First remember that it's not the inverse of the VIX, and you're on the way to understanding it.
- Next remember that XIV has none of the characteristics of stocks and stock funds that commentators love to go on about during the market news cycle. There are no resistance or support levels, no Elliott waves, no dividends, no quarterly earnings reports, no head-and-shoulders or death crosses, none of it. Volatility is a completely different asset class, with almost completely different drivers.
What is XIV good for? Who would buy it??
- Long-term holders: XIV is the most liquid, easily purchased contango-driven volatility play around. It's going to have wicked drawdowns if you just buy-and-hold XIV, but the kick to the overall portfolio of holding a small portion seems worthy of consideration.
- Traders: Traders with knowledge of the predictors of VIX futures (like the VRP and roll yield) purchase XIV when these indicators suggest that on average, XIV is likely to gain daily value from the futures term structure. And that's most of the time.
Sum up for Trading the VIX: The tailwinds that drive profits in the volatility class are VRP and roll yield. Failing to account for (or betting against) the tailwind is the Number One cause of investment loss and frustration in volatility trading. There is no comparable tailwind in the equities market, other than the modest Equity Risk Premium that produces elevated long-term returns for equities compared with fixed-income investments.
Part 4: Trading Volatility with Algorithms
So that's about all there is to it, really. You stay in XIV most of the time, but if VRP and roll yield suggest that VXX is more advantageous, switch to VXX. You end up with a strategy that still has some pretty stomach-churning drawdowns, but they tend to be more short-lived and your CAGR shoots through the roof at 45%, 60%, even 80% or higher average annual gains. Using strategies that may only require looking up a number on a website, and making a trade at the end of the market day accordingly, or at worst using a calculator or a spreadsheet. Let's take a look at one simple one based on contango/backwardation.
Caveat: This is one simple algorithmic strategy. It produces higher backtested returns than buy-and-hold XIV with lower drawdowns. But it's still not a very good volatility strategy (drawdowns are merely terrible, rather than devastating), and I don't really recommend it for trading, much better ones are available publicly, and I'll be covering some of them soon on this website. But this is a good, simple starter algorithm that works on many levels and appears to be reasonably robust (i.e., insensitive to minor changes in key variables). It's a lot better than some suggestions you'll read in comments on blog posts having to do with VIX levels for buy and sell signals. But I wouldn't trade this one, if I were you. It's just an example.
Algorithms: An algorithm is a systematic decision making process, involving logical steps. That's all it is, unless you're a mathematician and need a more evolved definition for your field. Sometimes an algorithm for investing takes the form of elaborate mathematical calculations, other times it may simply mean compare two inputs and make a decision according to that comparison. Algorithmic in this sense is practically synonymous with systematic... instead of making investment decisions based on our gut instinct or prejudices or tips from brokers, systematic/algorithmic investing has a defined plan and follows it. Algorithmic investing should be compatible with backtesting, using historical data inputs (prices, indexes) to see if the algorithm would have worked in the past, to experiment with it and see what sorts of market conditions might have given it trouble, etc. But above all, an algorithm should make sense logically. We can only have confidence in investment decisions from an algorithm if we understand the logic behind it.
A little bit about backtesting. Backtesting is the process of trying out a trading strategy idea against a historical data set, and see how it does. You start with some historical price data (like VXX and XIV), which looks like a bunch of rows in a spreadsheet, with dates in the first column (A) and adjusted closing prices in columns B (VXX) and C (XIV). Then you add some more data that you can find online, like values for the VIX index (D) and 2/1 contango (E).

Benchmark: Next you establish a baseline: what am I going to compare my strategies performance to? We already know that XIV has a remarkable 35% average annual gain since inception, so that seems a fine benchmark to try and beat. And who wouldn't be happy beating a long-term annual return like that? Of course, 6 years and a couple months isn't really very long-term, but XIV sure beats the S&P 500 over that period, a mere 12% CAGR in one of the best bull runs available for testing. If we can just improve those returns a bit, and reduce drawdowns a bit, hey we might just have something worth sharing.
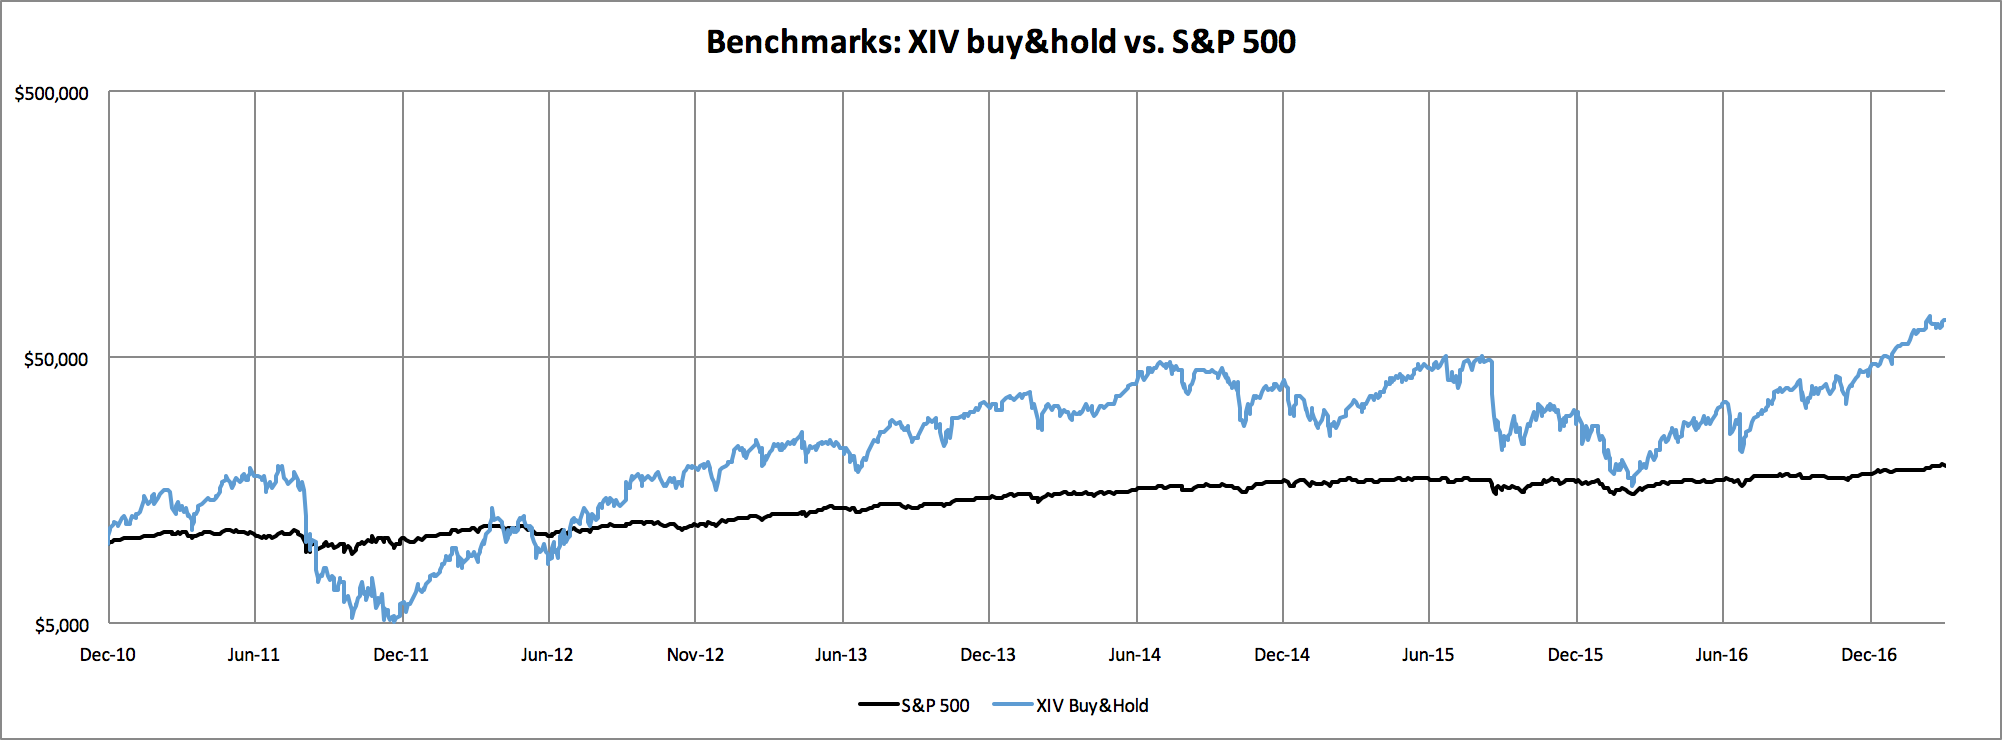
So let's take a look at that baseline performance of a buy-and-hold XIV portfolio since inception. Here are two graphs of it, first with a linear Y-axis, and next with a logarithmic (base 10) Y-axis. For fun here, we'll include the strong bull market S&P 500 for comparison (remember this graph only starts in late 2010, 18 months after the stock market low of the Great Financial Crisis).
Some notes: the X-axis starts Dec 1, 2010 (the second day of XIV trading) and runs to Mar 9, 2017 with ticks every six months from the beginning. The Y-axis (dollar value of an initial $10,000 portfolio) is linear for the first graph, and logarithmic for the second graph.
We like to use log scale for the portfolio returns for a couple of reasons, but we'll focus on one here: visual comparison of the rate of returns. If you look at the first (linear Y) graph, it sure looks like the rate of XIV portfolio growth is skyrocketing out of control, much faster than any other point in time. But compare that same steep slope in the second (logarithmic) curve with the steep slope in early 2012, just after the bug drawdown. With a log scale on the Y-axis, slope == annualized rate of return (% growth), whereas with a linear scale, slope == absolute rate of portfolio growth ($ growth). So that really steep (log scale) upward growth after the Dec 2011 drawdown is actually a higher annual return rate than most of 2016 (except maybe for the initial burst upward in Feb-Mar 2016).
Related: the first drawdown (Dec 2011) doesn't look as bad as those in 2015 on the linear scale, but looks like a real cliff on a log scale.
But... wow! XIV has a CAGR three times that of the S&P 500 during this period, nearly the rate of return to double the portfolio every two years (the S&P 500 nearly doubled over the 6+ years of this backtest, XIV doubled twice and a bit). But it's a stomach-churning ride. If you bought in at the beginning and could hold on, your $10,000 portfolio nearly doubled in the first 6 months then dropped back below $10k in five weeks, then dropped on down into the $5-6k range until the first anniversary of XIV's introduction. Then it began clawing its way back up, reaching $10k again in March 2012 and bobbling a bit until July when it started climbing again, reaching $20k before its second anniversary. Did you catch that? XIV is so explosive it can double, halve, halve again, and triple in value in the space of two years. But in the long run, we've got a clear bias toward contango and good times for XIV, resulting in a nearly seven-fold gain in the portfolio in just over six years.
Pretty tough benchmark to beat. But wouldn't it be great if we could somehow sell out of XIV before those big drawdowns, and buy back into XIV for the rest of the (good) times? That's the goal of this algorithm... let's see if using contango/backwardation can help us avoid the drawdowns enough to improve our returns against this XIV benchmark.
A Simple Contango Algorithm: Let's try a very simple one at first. We'll define contango vs backwardation based on the prices of the 1st and 2nd month futures contracts: we'll go long XIV if the front month futures are contango (F2>F1), sell and hold cash if we're in backwardation (F1>F2). About as simple as you get for algorithm rules. We're going to manage this strategy daily, looking at the futures prices near the close of market and making a market-on-close order to buy or sell depending on the contango signal.
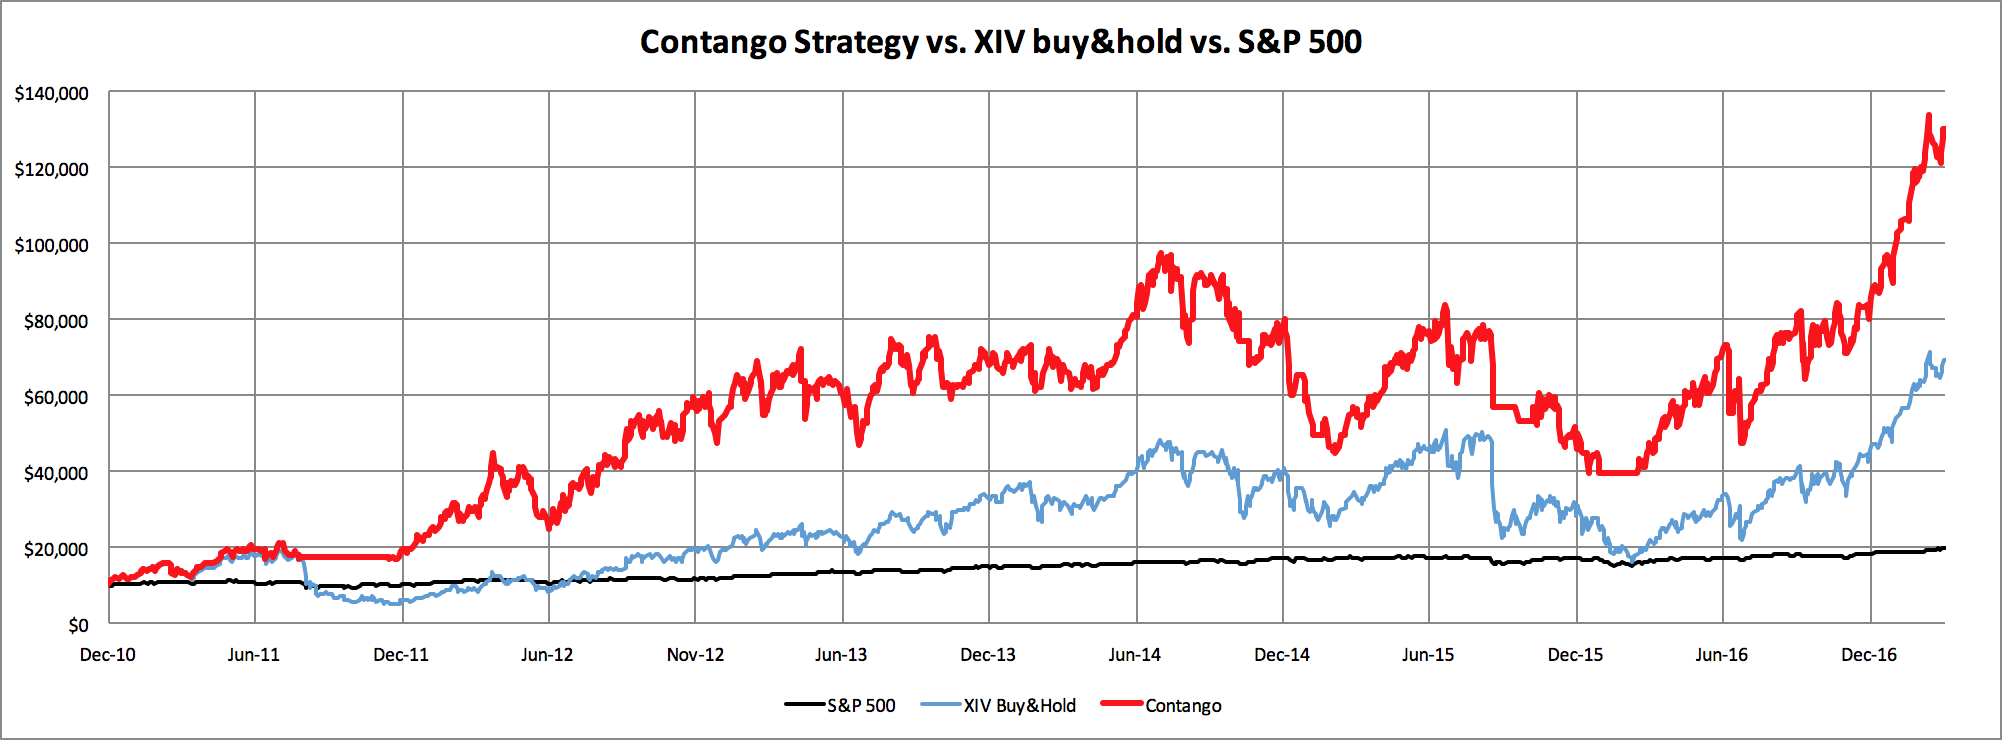
Not a bad first try, eh? First of all, check out the nice flat drawdown avoidance in late 2011. Contango did such a good job the drawdown was minimal and new highs were being made within about a month after the XIV buy-and-hold low of late 2011. The rate of return for this strategy jumps clear up to 50% CAGR, almost doubling the ending portfolio after six years compared to XIV buy-and-hold. It's not a great strategy yet... the drawdowns of 2014 and 2015 are both in the -50 to -60% range, so simple contango alone doesn't seem to be enough to solve all our XIV issues, but it made a great start.
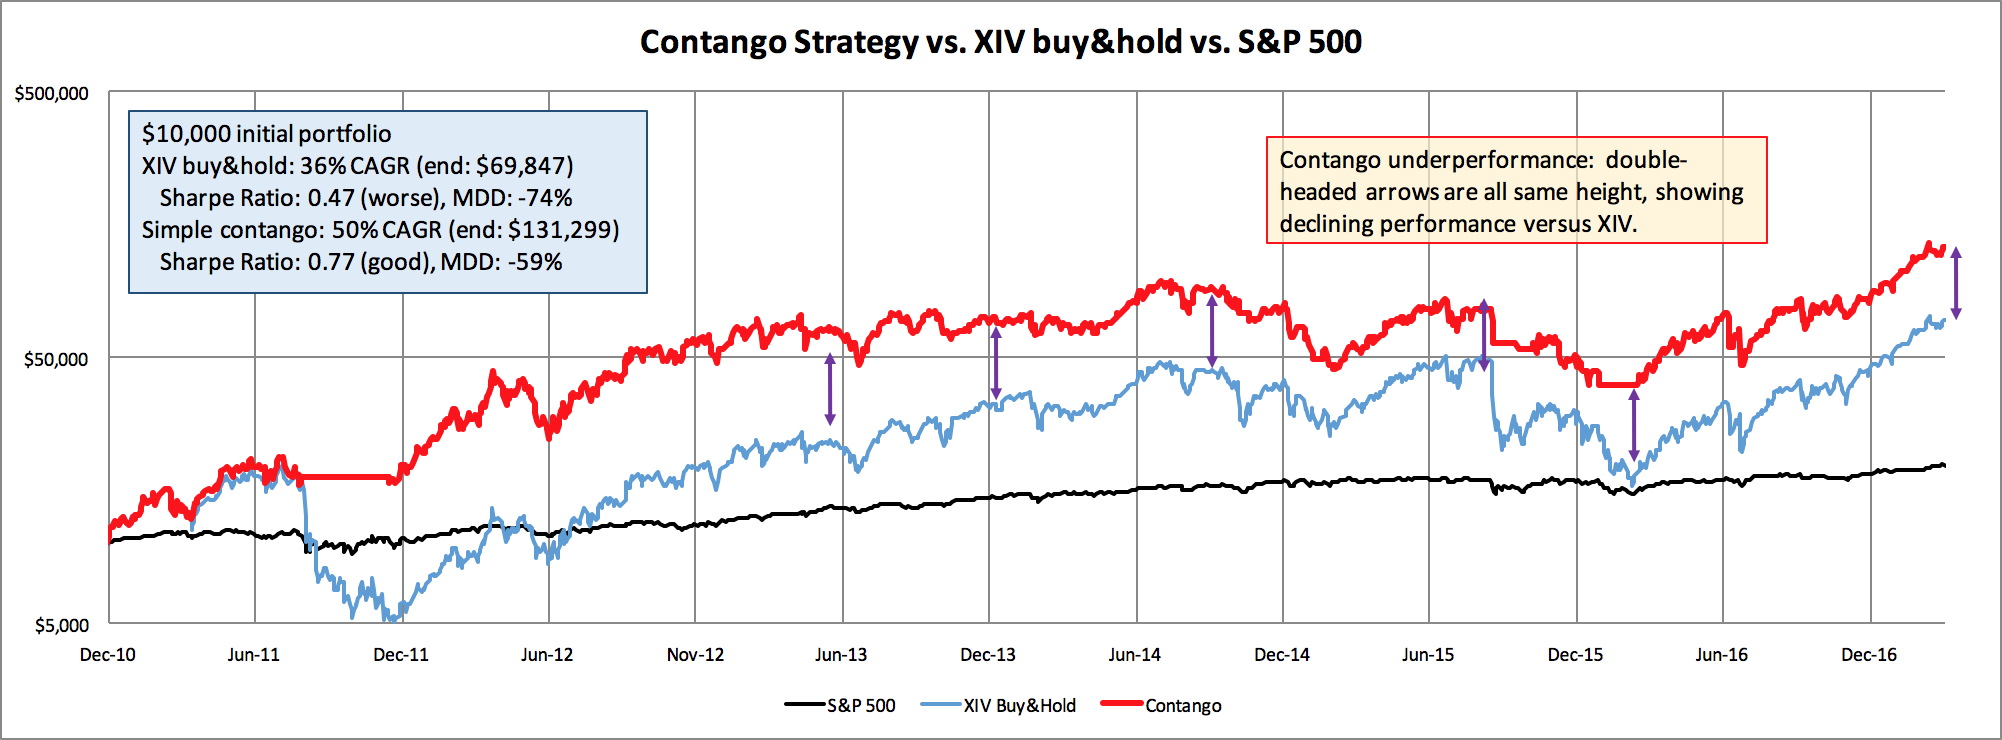
What is still going wrong then? Why did it fail in 2014 and 2015? First off, let's look more closely at the strategy vs XIV in log space (the second graph), not linear. For the first two years, everything is great... the big drawdown is avoided and the strategy return curve mimics the buy-and-hold curve almost perfectly. But from near the end of 2012 to August 2015 we have a narrowing of the space between the strategy curve and our XIV benchmark... a narrowing of this space means our strategy is underperforming the benchmark throughout this period. Follow the narrowing by looking at the double-headed arrows: they are all the same height (height of the end difference between XIV and this contango strategy).
It's fairly dramatic underperformance. XIV makes new highs in July 2015, surpassing the pre-drawdown highs of a year earlier. But our strategy fails to make a new high at the same time (a good strategy should be higher and sooner than the benchmark!), and in fact stays in drawdown for 2 1/2 years, until January 2017. But the narrowing between strategy and benchmark continues to this day. Simple contango is no longer a viable strategy.
A Higher Contango Threshold: Let's be a bit choosier; what if instead of being long XIV for all of the contango days, we only go long XIV if contango is solid, some threshold above the zero line?
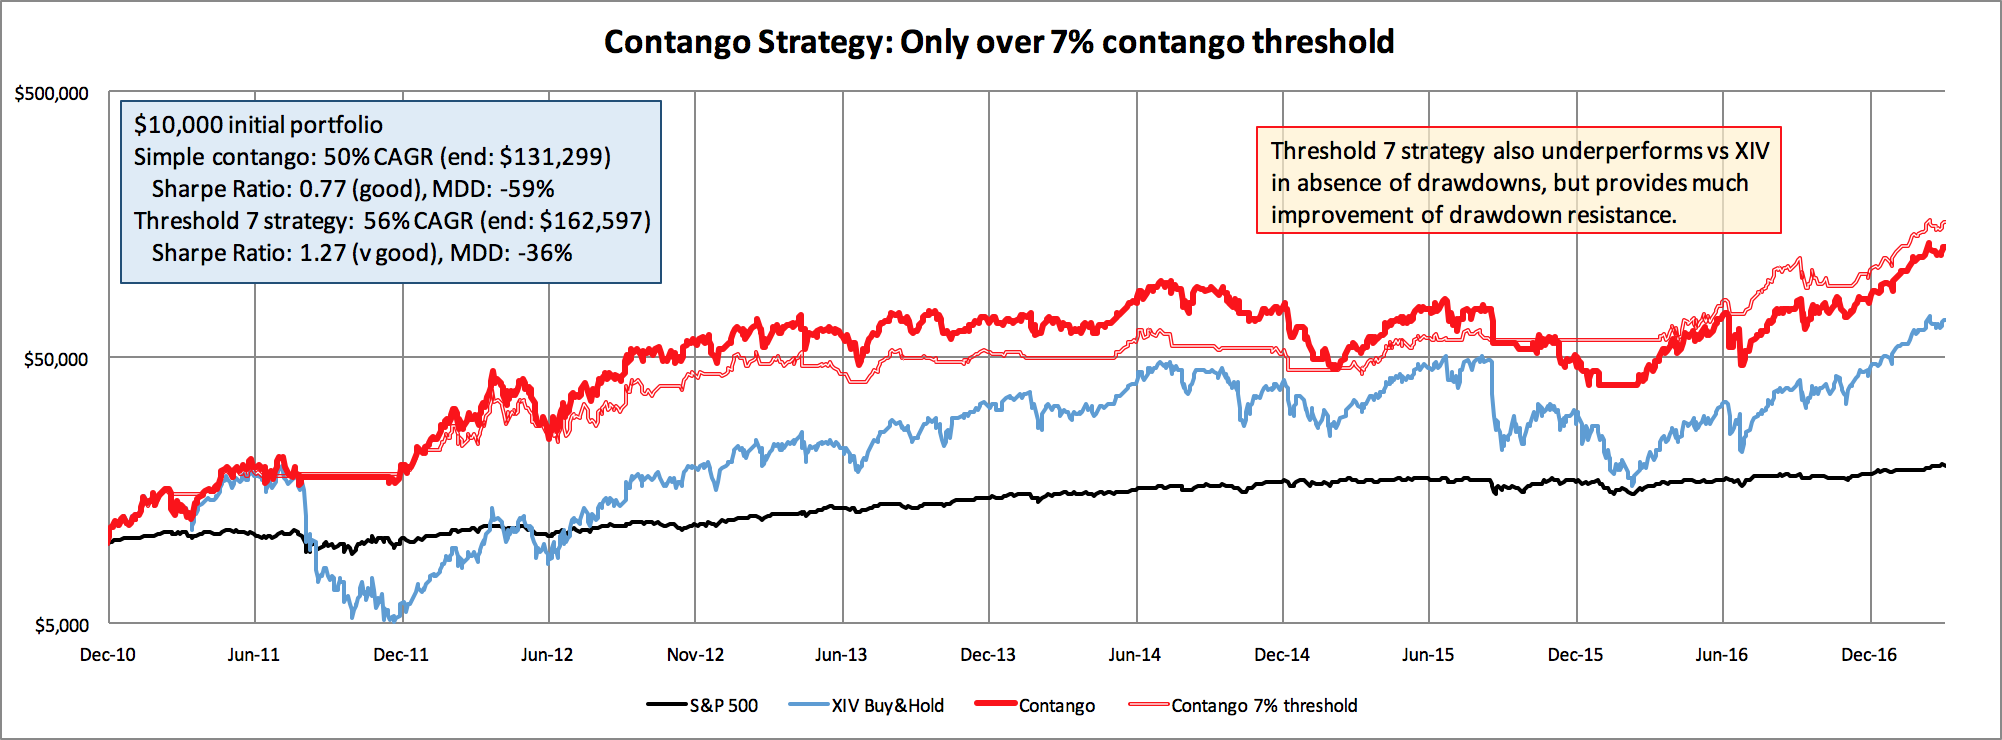
Ok, I tried this for you, and it's a tradeoff between days in the market and better win percentage. With a threshold of 0% (what we've been using) we're long XIV 88% of the market days. As the threshold steps up (1%, 2%, etc) the time spent long in XIV declines. With a 10% contango threshold you're down under 30% of days in the market... hard to win if you don't play. Findings: 6, 7, 8% all give us better results than 0%, but the other thresholds underperform.
So here's the strategy modeled with a 7% threshold. Using 6% actually gives a better portfolio return, but choosing the value in the middle of the three that do well is probably a safer bet (read more about backtesting, optimizing and overfitting noisy data to understand why).
PS. Only showing log scales for the Y-axis from here on out. Get used to them.
This is a very marginal improvement, at best. This strategy underperforms even worse than simple contango does when XIV is rising (because it's out of the market more days), but it seems to be doing a significantly better job handling the drawdowns safely. Notably, the Sharpe ratio for this "Threshold 7" strategy is over 1.2, which is far better than the 0.76 ratio of simple contango. The Sharpe ratio is a widely used measure of risk-adjusted returns... a higher Sharpe for the same CAGR roughly means there was a smoother ride (ie, better drawdown handling). Threshold 7 is only in the market 46% of market days, just over half the days of Simple Contango. I have to call Threshold 7 a failure with that miserable underperformance. Yay for the drawdown handling, not an improvement overall.
Smooth this ride: I think we're seeing a bit of whipsaw effect, trading in and out of the market too often, and our drawdowns are not all being handled very well. A common approach to reducing whipsaw trades is to add a moving average, so that the contango values are not bouncing around so much (contango is quite a volatile number).

Once again, I tried this for you. Values of 2, 3, 4, 5 and 6 days of simple moving averages (keeping the 7% contango threshold in place) all worked to reduce whipsaw, improve drawdown handling (selling sooner) and improve the overall portfolio return. I'm showing the 5 day SMA here, but it was not the very best performer.
Overall however, not much of an improvement. That significant underperformance early in 2012 isn't caught up until the end of 2014, and we end up only marginally better overall. I'm not measuring whipsaw quantitatively here, but the short story is that this still underperforms in the bull markets, but improves drawdown significantly (both visually in the graph, and overall with a reduced maximum drawdown of 29%).
Smoothed and faster response: Finally, but where a simple moving average works, an exponential moving average often works better. The idea is to weight the most recent values more highly than the earlier ones, giving you a more rapidly responding moving average to quickly changing circumstances. Contango certainly is a moving target, so perhaps an EMA approach will do a better job getting us out of the market when things are going bad for us.
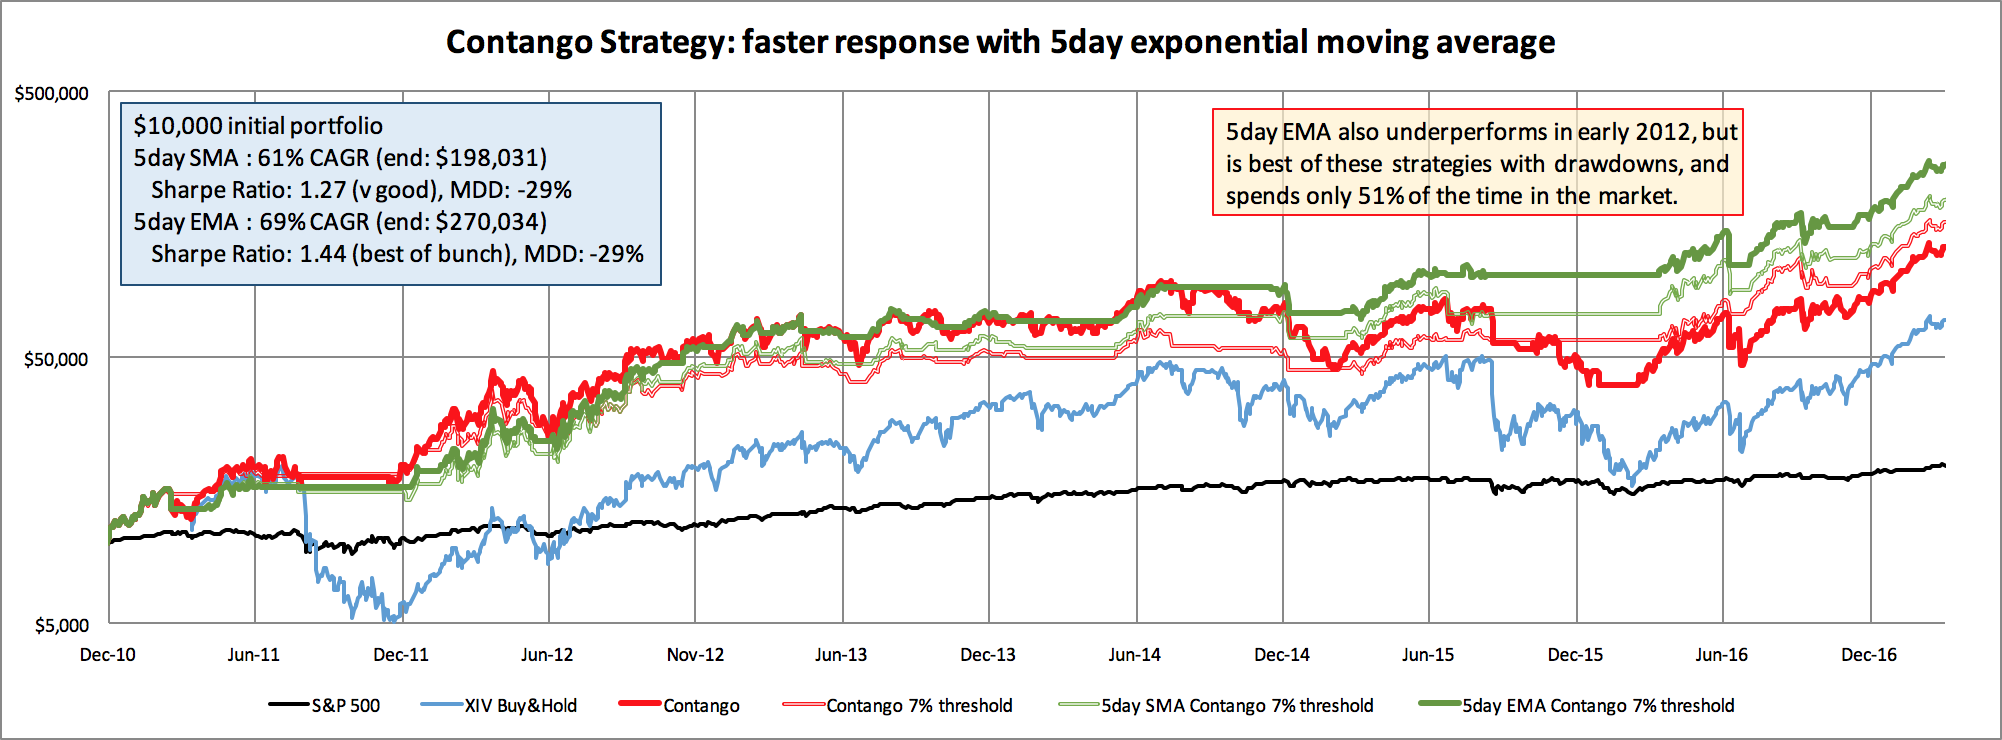
This is pretty nice. It performs pretty much as well as the original simple contango strategy for the early part of the backtest, and then does a great job avoiding the drawdowns of the 2014-2016 period, instead making new highs on a regular basis. There remains a little bit of underperformance compared to XIV buy-and-hold during the strong bull market, low volatility periods, so that's not great. But on the other hand, there don't seem to be any long-lived drawdowns, and no 12-month periods that don't make money, and the maximum drawdown is only 29% (same as the 5day SMA). That's really quite nice.
In fact, consider that a moment further. On its face, this strategy has a 29% max drawdown with a 69% CAGR. In that same time period, the S&P 500 has a max 19% drawdown, which sounds a lot safer. But the S&P 500 only has a 12% CAGR, so it would take significantly longer for the S&P 500 to recover (on average) from its max drawdown than would this EMA Contango strategy. No matter what the Sharpe ratio difference is, when the CAGR is substantially higher than the max drawdown, a strategy will likely perform more satisfactorily than the opposite situation where the CAGR is less than the maximum drawdown (I'm looking at you, S&P 500, and you too XIV buy-and-hold).
Sum Up: Volatility is an asset class very unlike the equities. With a company stock there are value trading strategies (based on company fundamentals), and price action strategies such as momentum and mean reversion. With ETFs you can do the same with the market as a whole, or sector by sector. But there is no tailwind that can drive a stock forward, other than good management and good fundamentals, and even those tend to only work well if the rest of the market is doing well too. But volatility has true tailwinds built in, and the tailwinds are identifiable, and have a strong tendency to persist for days and weeks at a time. We've shown that here with a very simple contango strategy for limiting when we are in the market long for XIV. By strategically reducing days in the market by nearly half, we nearly doubled the CAGR from 36% to 69%, reduced the max drawdown from 74% to 29%, and tripled the Sharpe ratio to a respectable 1.44.
We took a simple strategy approach I still don't think this is a viable strategy to trade real money on. But it's hella better than buy-and-hold XIV would be. You can do significantly better with a little homework (and using more of a VRP approach, rather than simple contango), but this can be easily hacked together with a spreadsheet and some historical data and shows just a taste of how profitable the volatility asset class can be. Consider: all we did was cut out a bunch of days that we were trading. A really good strategy will be in the market almost every day, and will be profitable with both XIV and VXX by trading both sides. Long-term strategies with a CAGR north of 100% are quite plausible.
Data sources: So all you need for this strategy is to know the current contango values. Vix futures prices are widely available as a delayed feed, but the best place right now is VIX Central, where they display updated (and historical) graphs of the VIX futures term structure, along with a nice little table of contango values just below.
Historical data: If you want to build yourself a little spreadsheet for playing with these strategies, you'll need some data. Go to Yahoo for XIV and VXX, and for ^VIX and ^GSPC (symbol for the S&P 500). VIX Central has historical futures prices for the VIX futures along with daily contango values. I'll turn these into URLs soon.
Caveat: Backtesting: If you're actually going to do any backtesting yourself, please learn how to do it right and don't believe everything you do. It's easy to fool yourself (who doesn't want to believe that a great backtest result is really valid?) in umpteen different ways.
Caveat: Again, don't trade this strategy; much better ones are available published, let alone proprietary ones that you can subscribe to.
Part 5: Volatility Trading FAQ
Question 1: WTF? For three days now, SPY has been dropping, but XIV keeps going up! I thought XIV goes down as the market falls?!
Answer 1: WTF! Are you not listening?! XIV is not a measure of SPY performance! I'll stop with the exclamation marks now. Although there's decent long-term positive correlation between XIV and SPY, it's just a correlation and far from being a cause and effect relationship. In this case (early March, 2017), to explain XIV just take a look at (#1) roll yield (it favors XIV right now) and (#2) daily volatility expectation changes - volatility has been dropping (dropping vol favors XIV) since a bump last week. VIX too has been dropping since the middle of last week. XIV goes up as a result of #1 + #2. And for crissakes, we're talking tiny tiny daily changes here, not like some huge disconnect. Get some perspective and do your homework. Day-to-day, don't expect SPY and XIV to dance in lockstep, it doesn't work that way. If you follow XIV, follow the details of what it responds to as well.
-------
Question 2: Oh, ok. Well can you be more directly explicit then as to what precisely controls the daily price changes of XIV? How much of it is roll yield vs volatility, and what measure of volatility is important here?
Answer 2: Now you're talking. Good question, because I didn't cover that deeply up above. Really short answer: Roll yield averages about ~15-20% of the daily price change, and changes in the 30-day constant maturity VIX futures price (a measure of future volatility expectations) drives the rest of it.
Richer, fuller answer: I'll cover these concepts in future blog posts (and update this primer with those links), but meanwhile I will refer you to the dense but carefully laid out arguments and spreadsheet of David Easter, a contributor at Seeking Alpha. Here is a link to his "My Investing Publications" page, which has several good things, but in particular go read one:
- "Why XIV Appreciates In Value: Debunking The Myths And Misconceptions About Contango" (March 2016)
-------
Question 3: That's a great reading. How about some more great volatility reads?
Answer 3: Ok, might as well build the list here as anywhere. This is just a start, it's an ongoing process.
Pretty good volatility links (browse each of these blogs/authors for other works too)
- How does VXX work?
- How does XIV work?
- The Cost of Contango — It’s Not the Daily Roll
- Why XIV Appreciates In Value: Debunking The Myths And Misconceptions About Contango (note: if Seeking Alpha ever puts this article behind its "Pro" firewall, somebody let me know and I'll post a bootleg PDF copy here)
- "My Investing Publications" - includes supporting spreadsheet links, etc
- DDN’s Volatility Risk Premium Strategy Revisited (2) (this article details the best published backtest with algorithm of a VRP-based volatility strategy that I'm aware of)
- morelinkssoon
Vance Harwood (Six Figure Investing)
David Easter (contributor at Seeking Alpha)
Frank (Trading The Odds)
-------
For more information about any of our work, you may contact us at info@v1trader.com and we'll respond promptly.